
Why Atlantic Hurricane Season Peaks in September?
September 10 is the Atlantic hurricane season’s climatological peak, but that does not mean a hurricane must exist on that date. Use the contrast to teach the difference between long-term patterns, seasonal outlooks, and daily forecasts.
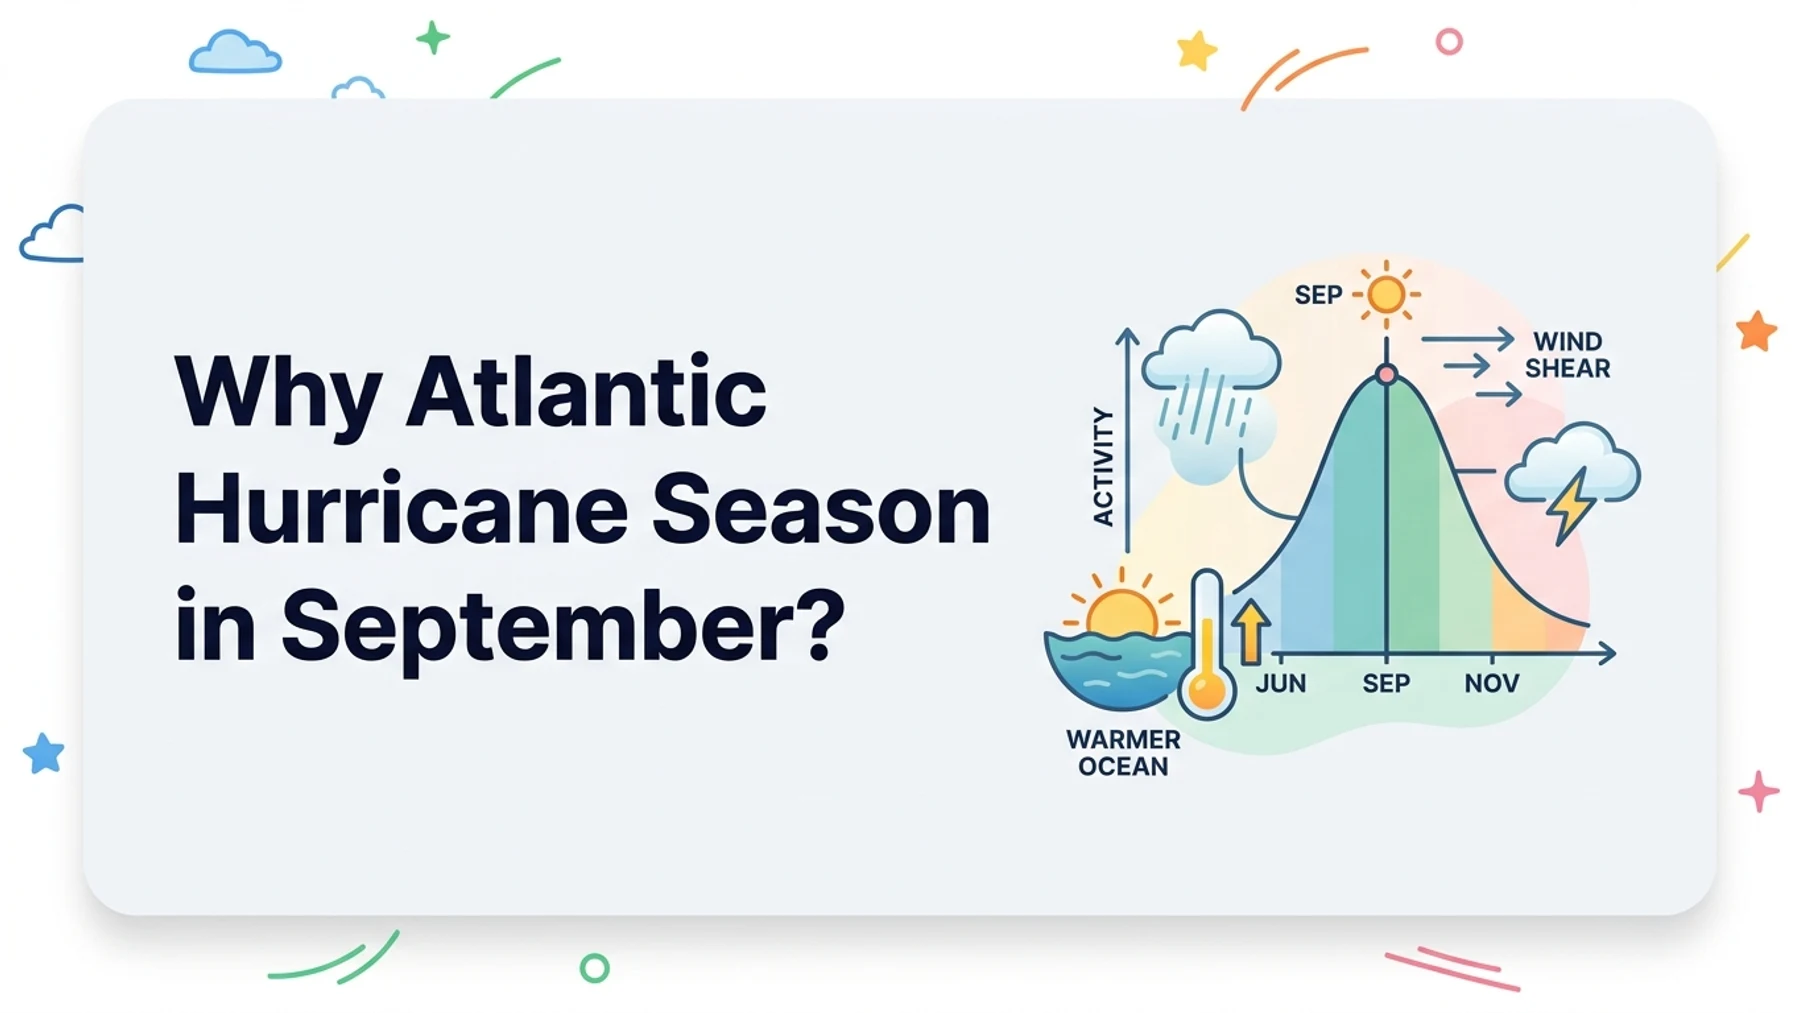
September 10 is the climatological peak of the Atlantic hurricane season. That does not mean a hurricane must form on September 10, reach its strongest point that day, or threaten a particular place.
In fact, a quiet peak day can make the science easier to teach. It gives homeschool learners a clear puzzle: How can today be the peak of hurricane season when no Atlantic hurricane is active?
The answer is the difference between a long-term pattern and a prediction. A climatology curve summarizes many years. A seasonal outlook describes probabilities for an entire season. A forecast describes expected conditions over a much shorter period. A warning tells people that hazardous weather is expected or occurring in a defined area.
Those sources answer different questions, and learning to separate them is a valuable weather and information-literacy skill.
What does “hurricane season peak” mean?
The Atlantic hurricane season officially runs from June 1 through November 30. National Hurricane Center climatology shows that activity usually rises through late summer, reaches its highest point around September 10, and remains concentrated from mid-August into mid-October.
Climatology is built from observations across many years. The familiar NHC activity curve combines past named-storm and hurricane activity by calendar day, smooths the data, and shows the typical seasonal shape.
It does not say:
- a storm will exist on every September 10;
- September 10 will be the busiest day in every season;
- a hurricane will strike the United States or any other location that day;
- a quiet start guarantees a quiet rest of the season.
Think of it like the average high temperature for a date. The average helps describe the climate, but tomorrow’s actual temperature can be higher or lower.
Why does Atlantic activity often peak in September?
Hurricanes need several ingredients to come together. These include sufficiently warm ocean water, moist air, an initial weather disturbance, enough distance from the equator for Earth’s rotation to help organize the circulation, and relatively low vertical wind shear.
Vertical wind shear is a change in wind speed or direction with height. Strong shear can tilt or disrupt a developing storm. Lower shear can make it easier for the storm’s thunderstorms to organize around a common center.
By late summer, large areas of the tropical Atlantic have absorbed months of solar energy. Ocean temperatures are warm, and atmospheric conditions are often more supportive than they were in spring or early summer. That combination helps explain the seasonal rise.
Still, ingredients are not guarantees. Dry air, strong shear, stable air, unfavorable disturbances, or steering patterns can limit development even when the ocean is warm. Weather depends on several conditions interacting at once.
Four weather products that answer different questions
Students often see a graph, outlook, forecast, and warning discussed together. Sorting them prevents a common mistake: treating every weather product as though it predicts the same thing.
| Product | Main question | Typical time scale | What it cannot tell you by itself |
|---|---|---|---|
| Climatology | What usually happens across many years? | Decades summarized by season or date | What will happen this week |
| Seasonal outlook | Is overall activity more likely to be above, near, or below normal? | The whole season or several months | Whether a storm will hit a particular town |
| Forecast | What weather or storm behavior is expected next? | Hours to days | The exact outcome weeks or months ahead |
| Watch or warning | Is a specific hazard possible or expected for an area? | Near-term, location-specific | The overall character of the whole season |
This table is not a substitute for an official alert. For any real safety decision, use current National Hurricane Center products, local National Weather Service information, and instructions from local officials.
Read the hurricane science first
Before asking learners to interpret a climatology graph, build enough background knowledge to understand what the curve represents.
PicoBuddy’s The Anatomy of a Hurricane: Genesis, Destruction, and Renewal is a current 8th grade explanatory passage. It covers warm water, moisture, vertical wind shear, the Coriolis effect, hazards, and recovery. The passage includes questions, an online quiz, a printable worksheet, and a Remix option.
If the original reading level is not right for your learner, use Remix from the passage page and review the result before assigning it. Simplifying sentences should not remove the scientific relationships students need for the graph lesson.
Give the reading one purpose:
Which conditions help a tropical disturbance become an organized hurricane?
Ask the learner to mark two details that will help explain why hurricane activity changes through the season.

Analyze the NHC climatology curve
Open the National Hurricane Center’s Tropical Cyclone Climatology page and find the Atlantic seasonal activity graph. Do not begin by explaining the graph for the learner. Let the learner notice its structure first.
Ask:
- What does the horizontal axis represent?
- What does the vertical scale describe?
- Where does the curve begin to rise quickly?
- Around which date is it highest?
- When does it begin to fall?
- Does the graph show the path of a particular storm?
The last question checks the most important distinction. The curve shows a long-term seasonal pattern. It is not a storm track and not a forecast map.
Next, ask the learner to write one accurate observation without explaining the cause:
The graph shows that...
Then add an interpretation supported by the reading:
One reason for this pattern may be... because the passage explains...
This separates observation from explanation. Students first state what the graph shows, then connect it to scientific background knowledge.
Compare climatology with the 2026 season
NOAA’s updated Atlantic outlook, issued August 6, 2026, gave a 75% chance of a below-normal season, a 20% chance of a near-normal season, and a 5% chance of an above-normal season. NOAA also emphasized that a seasonal outlook does not predict landfall for a particular location and that even a quieter season can produce a dangerous storm.
Now compare that outlook with two other pieces of evidence:
- the long-term NHC climatology curve, which still peaks around September 10;
- the NHC current-storm snapshot for the exact day you conduct the lesson.
For a dated example, the NHC CurrentStorms data on September 10, 2026 listed active systems in the eastern and central Pacific but none in the Atlantic. That quiet Atlantic snapshot did not make the climatology curve wrong. It showed that a long-term average does not control a single day.
Have the learner complete these statements:
- Climatology tells me...
- The seasonal outlook tells me...
- Today’s storm information tells me...
- None of these sources alone can tell me...
A strong answer might explain that climatology describes the usual seasonal pattern, the outlook describes probabilities for overall 2026 activity, and the current page shows what is active at a specific time.
A 35-minute homeschool lesson
10 minutes: build the science background
Read the hurricane passage at an appropriate level. Identify the conditions that support or disrupt development.
8 minutes: read the climatology graph
Label the axes, find the peak, and write one observation that the graph directly supports.
8 minutes: compare sources
Read the current seasonal outlook summary and check the current Atlantic status. Name the question each source answers.
6 minutes: explain the apparent contradiction
Answer: “How can today be the climatological peak if no Atlantic hurricane is active?” Use the words long-term pattern and current conditions.
3 minutes: close with the safety boundary
Ask which source a family should use for a real near-term hazard. The answer should point to current official forecasts, watches, warnings, and local instructions, not a climatology graph or educational passage.
The bigger science-literacy lesson
Weather information becomes confusing when a long-term average, a probability, and a daily forecast are treated as interchangeable.
September 10 offers a memorable way to correct that confusion. The Atlantic hurricane season can be at its climatological peak even on a quiet day. A below-normal seasonal outlook can coexist with serious risk. A hurricane-science passage can explain formation, but it cannot replace a live warning.
Read the science, examine the graph, and then check the current official information. When learners can explain which question each source answers, they are doing more than studying hurricanes. They are learning how to reason with evidence that operates on different time scales.
Frequently Asked Questions
Related Articles



Helping kids read better, together.
Like this article? Join 500+ educators using PicoBuddy to generate high-quality reading materials in seconds.